Inflation · 2021–2023
Revenue that can reset
Inflation-linked contracts and tariff resets helped revenues adjust as prices rose. The core benchmark returned 11.6% a year in this period.
Equity / Core

The Core strategy
We seek long-term ownership of operating infrastructure that delivers essential services. Our focus is resilient cash flow, contractual inflation protection and disciplined capital management.
The objective: preserve capital, generate sustainable income and compound value across economic cycles.
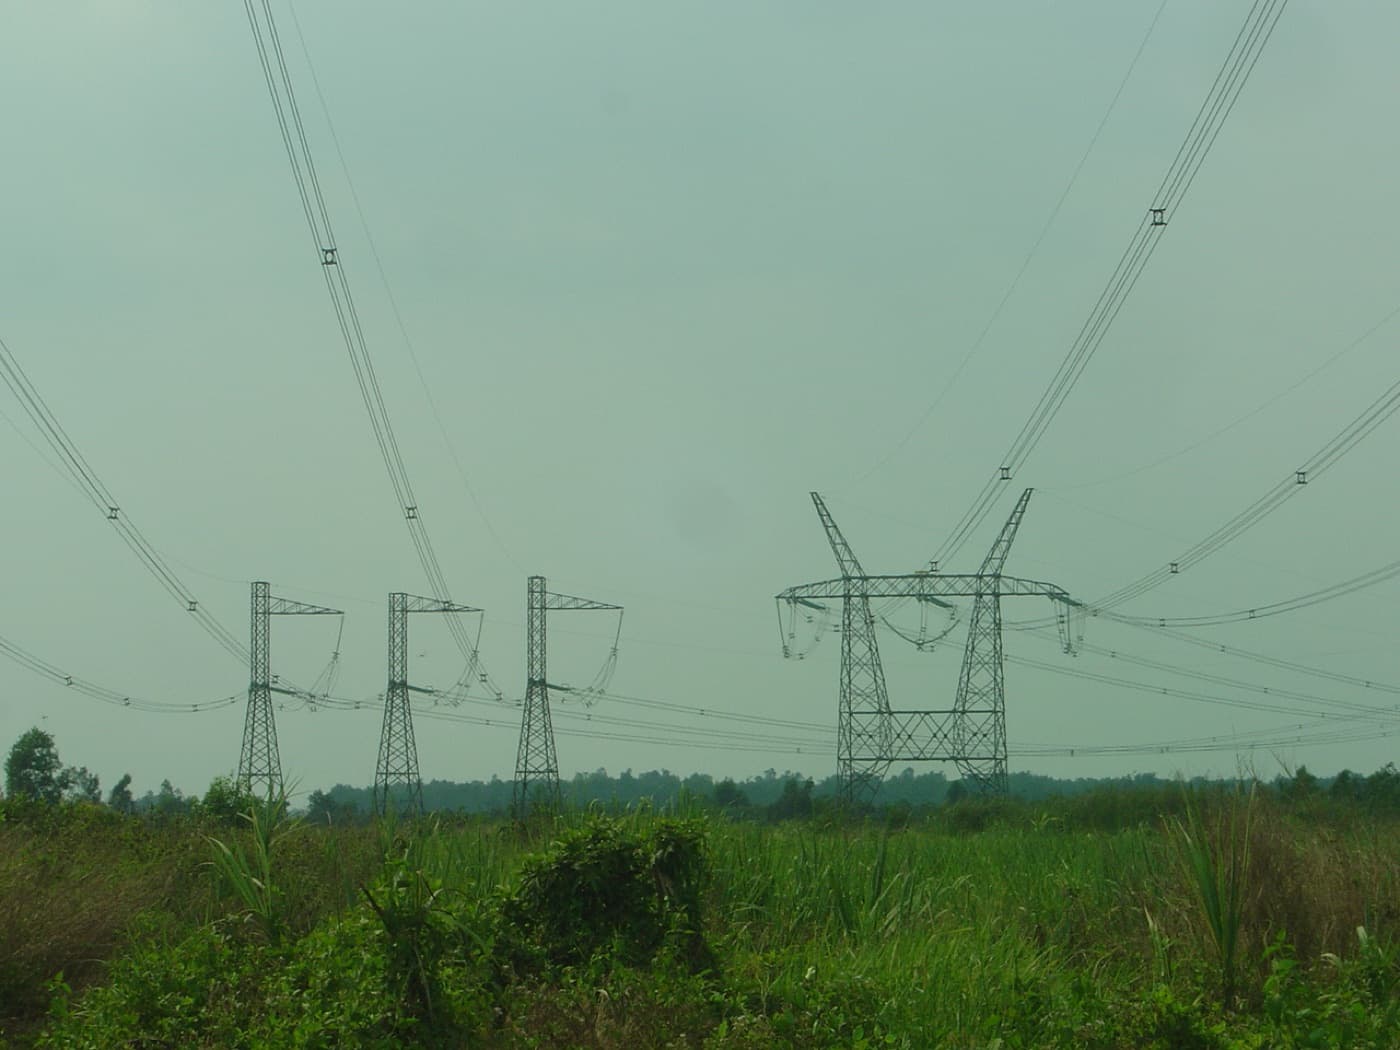
Our investment approach connects asset selection, rigorous underwriting and active ownership. Each stage supports the same objective: durable income and long-term capital preservation.
Select established assets that provide essential services, face limited competition and earn revenue through durable contracts or regulated tariffs.
Test cash flows, counterparties, asset condition and contractual protections through downside scenarios. Invest at disciplined valuations with leverage the asset can sustain.
Maintain reliability, control costs and plan capital expenditure. Strengthen revenues and pursue selective improvements while limiting development and speculative exposure.
Target sustainable distributions, reinvest selectively and manage refinancing. Preserve the flexibility to hold assets through market cycles and compound value over time.
Core infrastructure combines essential services with contracted or regulated income. Its history shows how those features can support returns when markets come under pressure.
June 2021–September 2023 · Annualised total return (%) · USD
Bars share a −10% to +15% scale; the vertical line marks zero.
Core / overall infrastructure: MSCI Global Private Infrastructure Index, Low Risk / All. US equities: S&P 500 Total Return. Global equities: MSCI World. Core real estate: INREV GREFI. Global bonds: Bloomberg Global Aggregate Total Return. All in USD. The source labels US 10-year Treasuries without specifying a series identifier. Private infrastructure uses periodic valuations, which can smooth reported returns relative to daily traded markets.
Inflation · 2021–2023
Inflation-linked contracts and tariff resets helped revenues adjust as prices rose. The core benchmark returned 11.6% a year in this period.
Financial crisis · 2008–2009
Macquarie reports a 23.2% maximum core-infrastructure drawdown versus 48.6% for equities. The measurement starts differ: March 2008 for infrastructure and September 2007 for equities.
Applying the lesson
For a Vietnamese asset, examine when tariffs reset, who pays, and when borrowing must be refinanced. These terms determine whether rising revenue translates into cash for owners.
Core infrastructure’s reported benchmark combined a 9.9% annualised return with 7.8% volatility. The comparison below puts that history alongside equities, bonds and real estate.
31 March 2008–31 December 2025 · Annualised figures · USD
Swipe the chart to see the full comparison, or expand the figures below.
| Asset class | Return % | Volatility % | Sharpe |
|---|---|---|---|
| Core infrastructure | 9.9 | 7.8 | 1.10 |
| US equities | 11.8 | 16.7 | 0.63 |
| Global equities | 9.2 | 17.4 | 0.45 |
| Global corporate bonds (high yield) | 6.6 | 12.2 | 0.43 |
| Global corporate bonds (investment grade) | 3.2 | 8.0 | 0.22 |
| Core real estate | 2.9 | 7.0 | 0.21 |
| US 10-year Treasuries | 2.4 | 8.8 | 0.12 |
| Global government bonds | 1.6 | 6.8 | 0.03 |
Higher points earned more; points further right fluctuated more. The Sharpe ratio measures excess return per unit of volatility. Core’s reported ratio was 1.10, falling to 0.96 after adjusting for appraisal smoothing.
Periodic private-asset valuations can understate fluctuations. Volatility also misses liquidity, refinancing and regulatory exposure. For our Vietnam focus, assess the contract, counterparty and debt structure alongside the benchmark.
Core infrastructure averaged a 4.0% historical yield in this comparison, ahead of listed equities, government bonds and core real estate. For operating assets, regular income is a central part of the ownership case.
31 December 2016–31 December 2025 · Average yield (%) · USD benchmarks
Yield measures income relative to asset value. Total return also includes changes in that value. The 5.1% corporate-bond comparison combines high-yield and investment-grade debt, with a different credit profile.
For contracted power, toll roads and industrial utilities, focus on cash available after operating costs, maintenance, tax and debt service. Entry price and distribution rights determine how much of that cash reaches the owner.
Core infrastructure
Hóc Môn · Ho Chi Minh City
Built to treat 300,000 m³ of water a day, Tân Hiệp 2 began commercial supply in 2017. Its treated water is sold wholesale to SAWACO for the city’s distribution network.
An essential service, an operating plant and a wholesale customer: a local example of the business model behind core infrastructure.
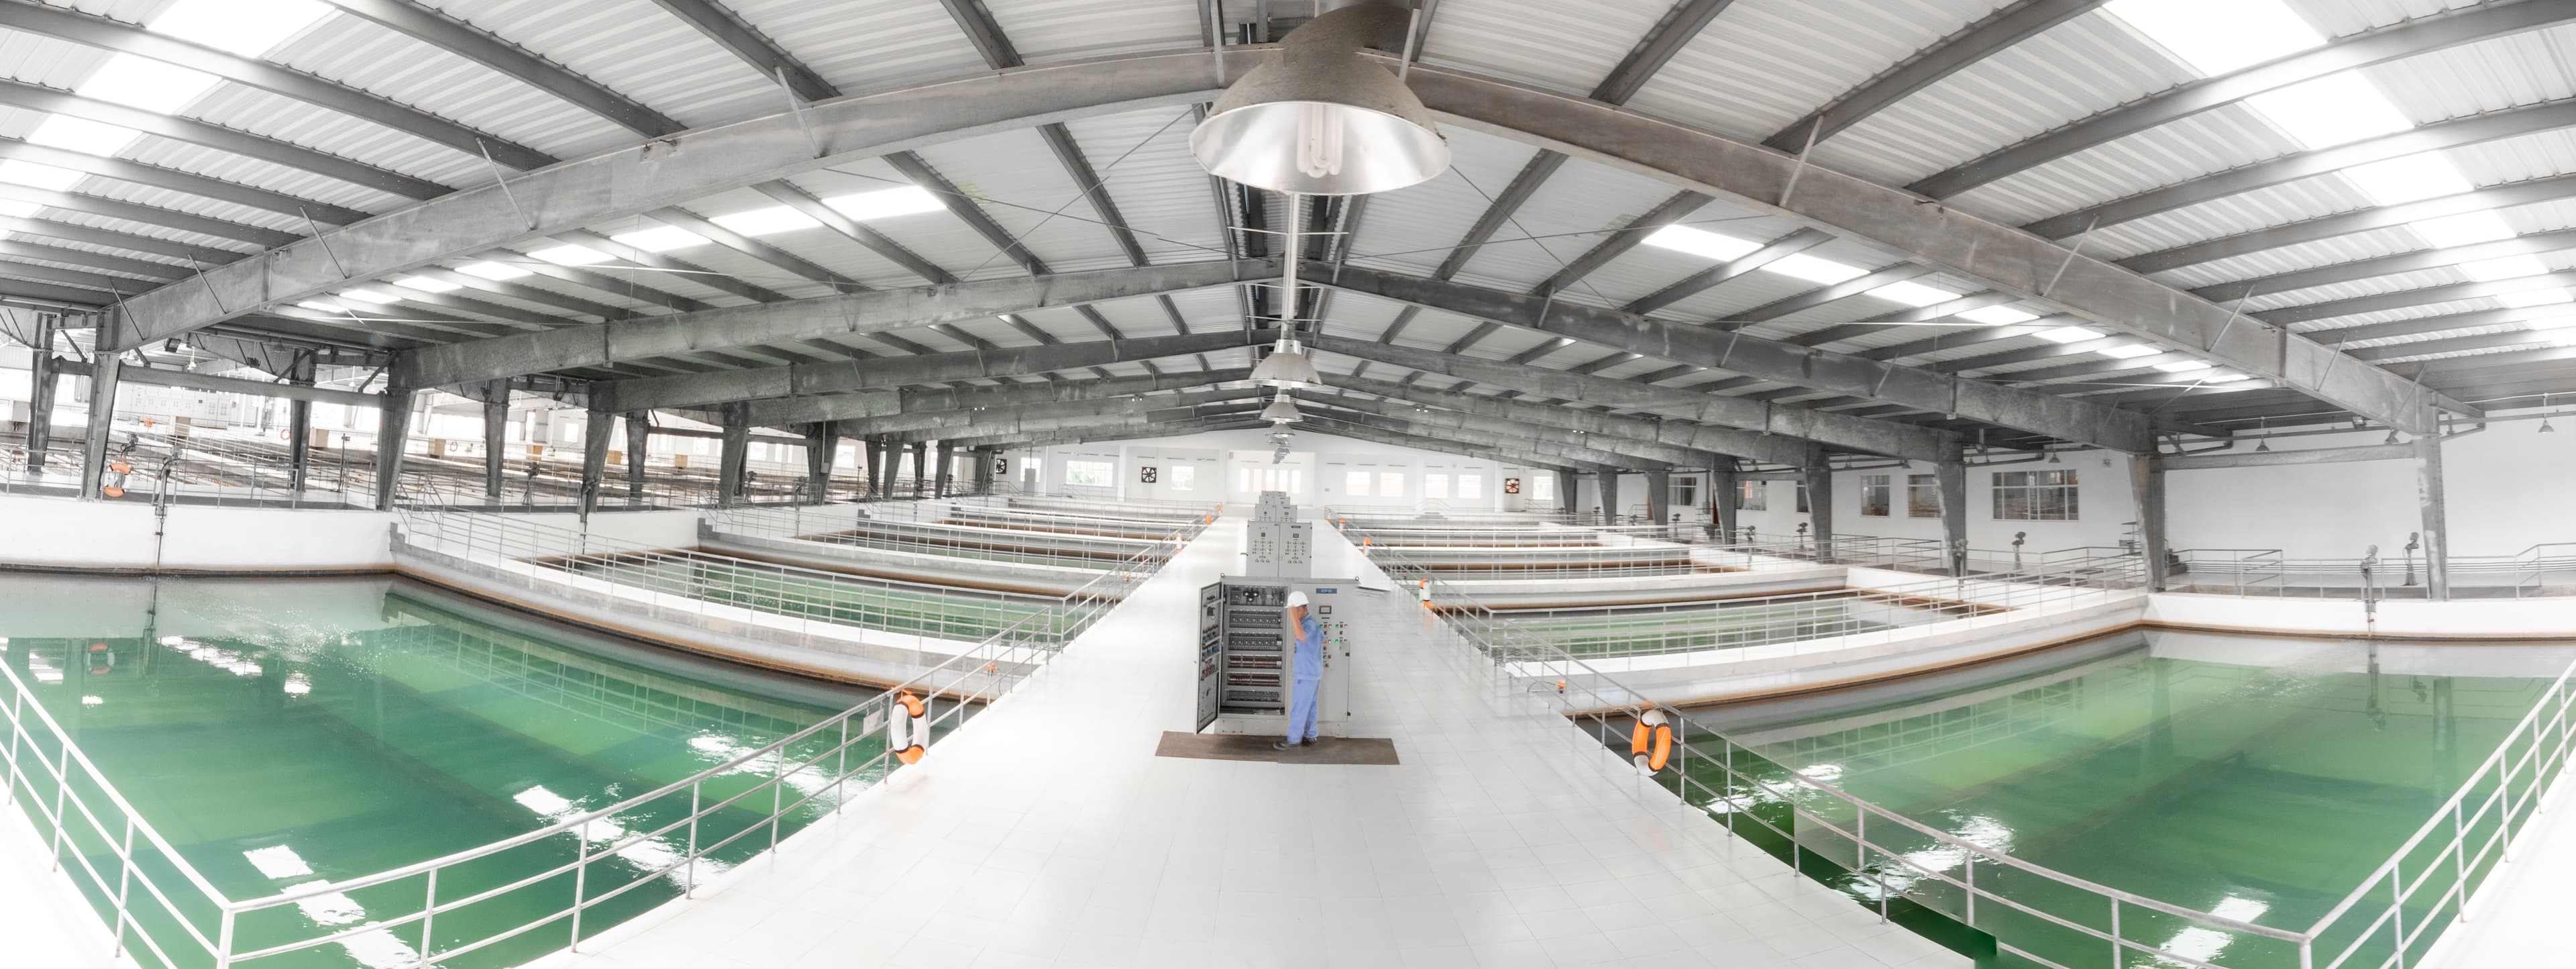
Water infrastructure behind the city’s daily life
For investors, sponsors and developers
Investors can request an allocation to invest alongside us. If you are raising equity or debt for an infrastructure asset or platform in Vietnam or the region, tell us about it here; the answers help us see quickly whether it fits one of our strategies.
Every request is read by the team. You can also write to NDD@corvusindustries.com.
Related research
Inquiries
Tell us what you are working on. We will reply personally to discuss how we can help you invest, enter, or grow in Vietnam.